
Transforming Your Business with GIS-Enabled Mapping & Dashboards
Visualize your data and gain powerful spatial insights with Aeologic's GIS-Enabled Mapping & Dashboard solutions. We leverage Geographic Information Systems (GIS) to create interactive maps, location-based analytics, and intuitive dashboards that transform complex geospatial data into actionable intelligence. Our solutions help businesses in various sectors make informed decisions.
Why Aeologic for GIS-Enabled Mapping & Dashboards?
Aeologic combines strong GIS expertise with web and mobile development capabilities to deliver tailored mapping solutions. We are proficient in leading GIS platforms (ArcGIS, QGIS) and open-source libraries, ensuring we can build the right solution for your specific requirements, whether it's a simple web map or a complex geospatial analytics platform.
Key Benefits of Our GIS-Enabled Mapping & Dashboards
- Enhanced data visualization through interactive maps.
- Improved decision-making with location-based insights.
- Optimized resource allocation and route planning.
- Better understanding of spatial patterns and trends.
- Effective communication of geographic information.
- Integration of diverse datasets onto a common map interface.
- Customizable dashboards for specific analytical needs.
- Support for real-time data feeds and dynamic mapping.
Our GIS-Enabled Mapping & Dashboards Process
Geospatial Needs & Data Assessment
Understanding your mapping requirements, available data sources, and desired analytical outcomes.
Data Acquisition, Processing & Geocoding
Collecting, cleaning, transforming, and geocoding data to prepare it for GIS analysis and mapping.
GIS Analysis & Spatial Modeling
Performing spatial analyses such as proximity, overlay, network analysis, or suitability modeling.
Map & Dashboard Design (UI/UX)
Designing intuitive and effective user interfaces for maps and dashboards.
Application Development & Integration
Developing custom web or mobile mapping applications and integrating them with other systems.
Deployment, Training & Ongoing Support
Deploying the solution, providing user training, and offering continuous support and updates.
Real-World Applications: GIS-Enabled Mapping & Dashboards Use Cases
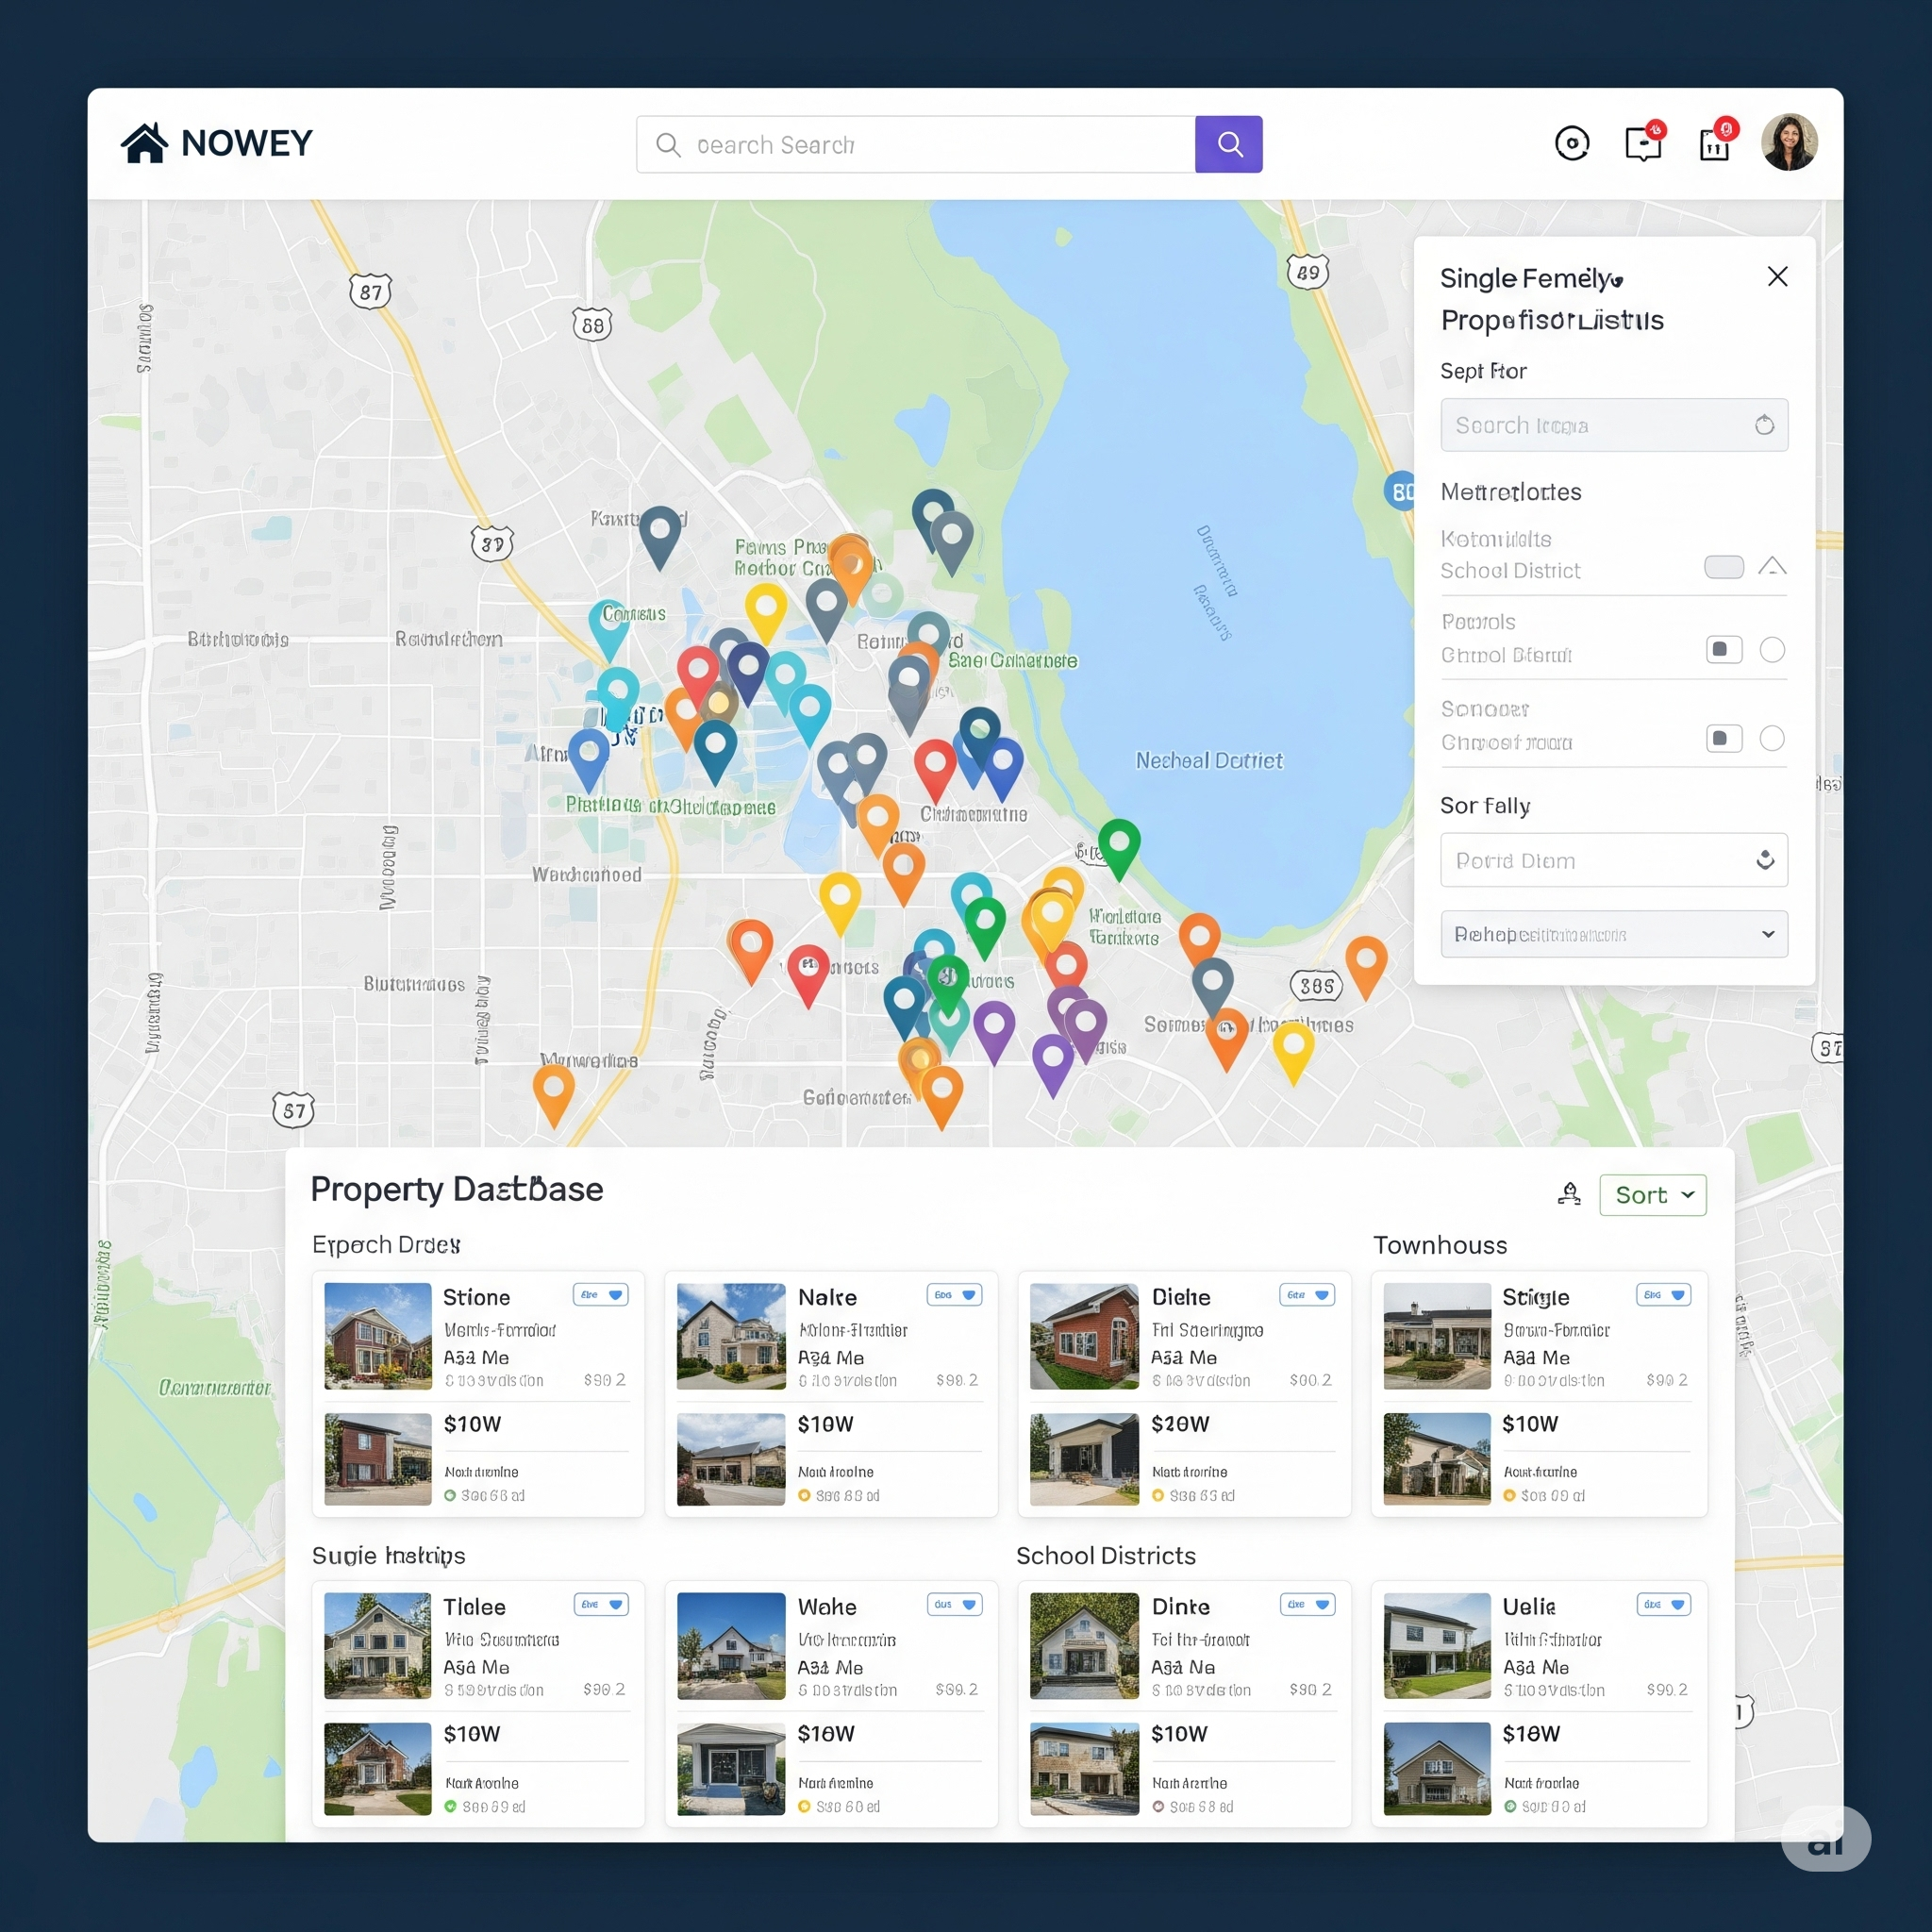
Interactive Web Map for Real Estate Listings
Developed a web map displaying property listings with filtering, search, and demographic overlay features.
Logistics Dashboard with Real-Time Vehicle Tracking
Created a dashboard showing live vehicle locations, delivery statuses, and route efficiencies on a map.
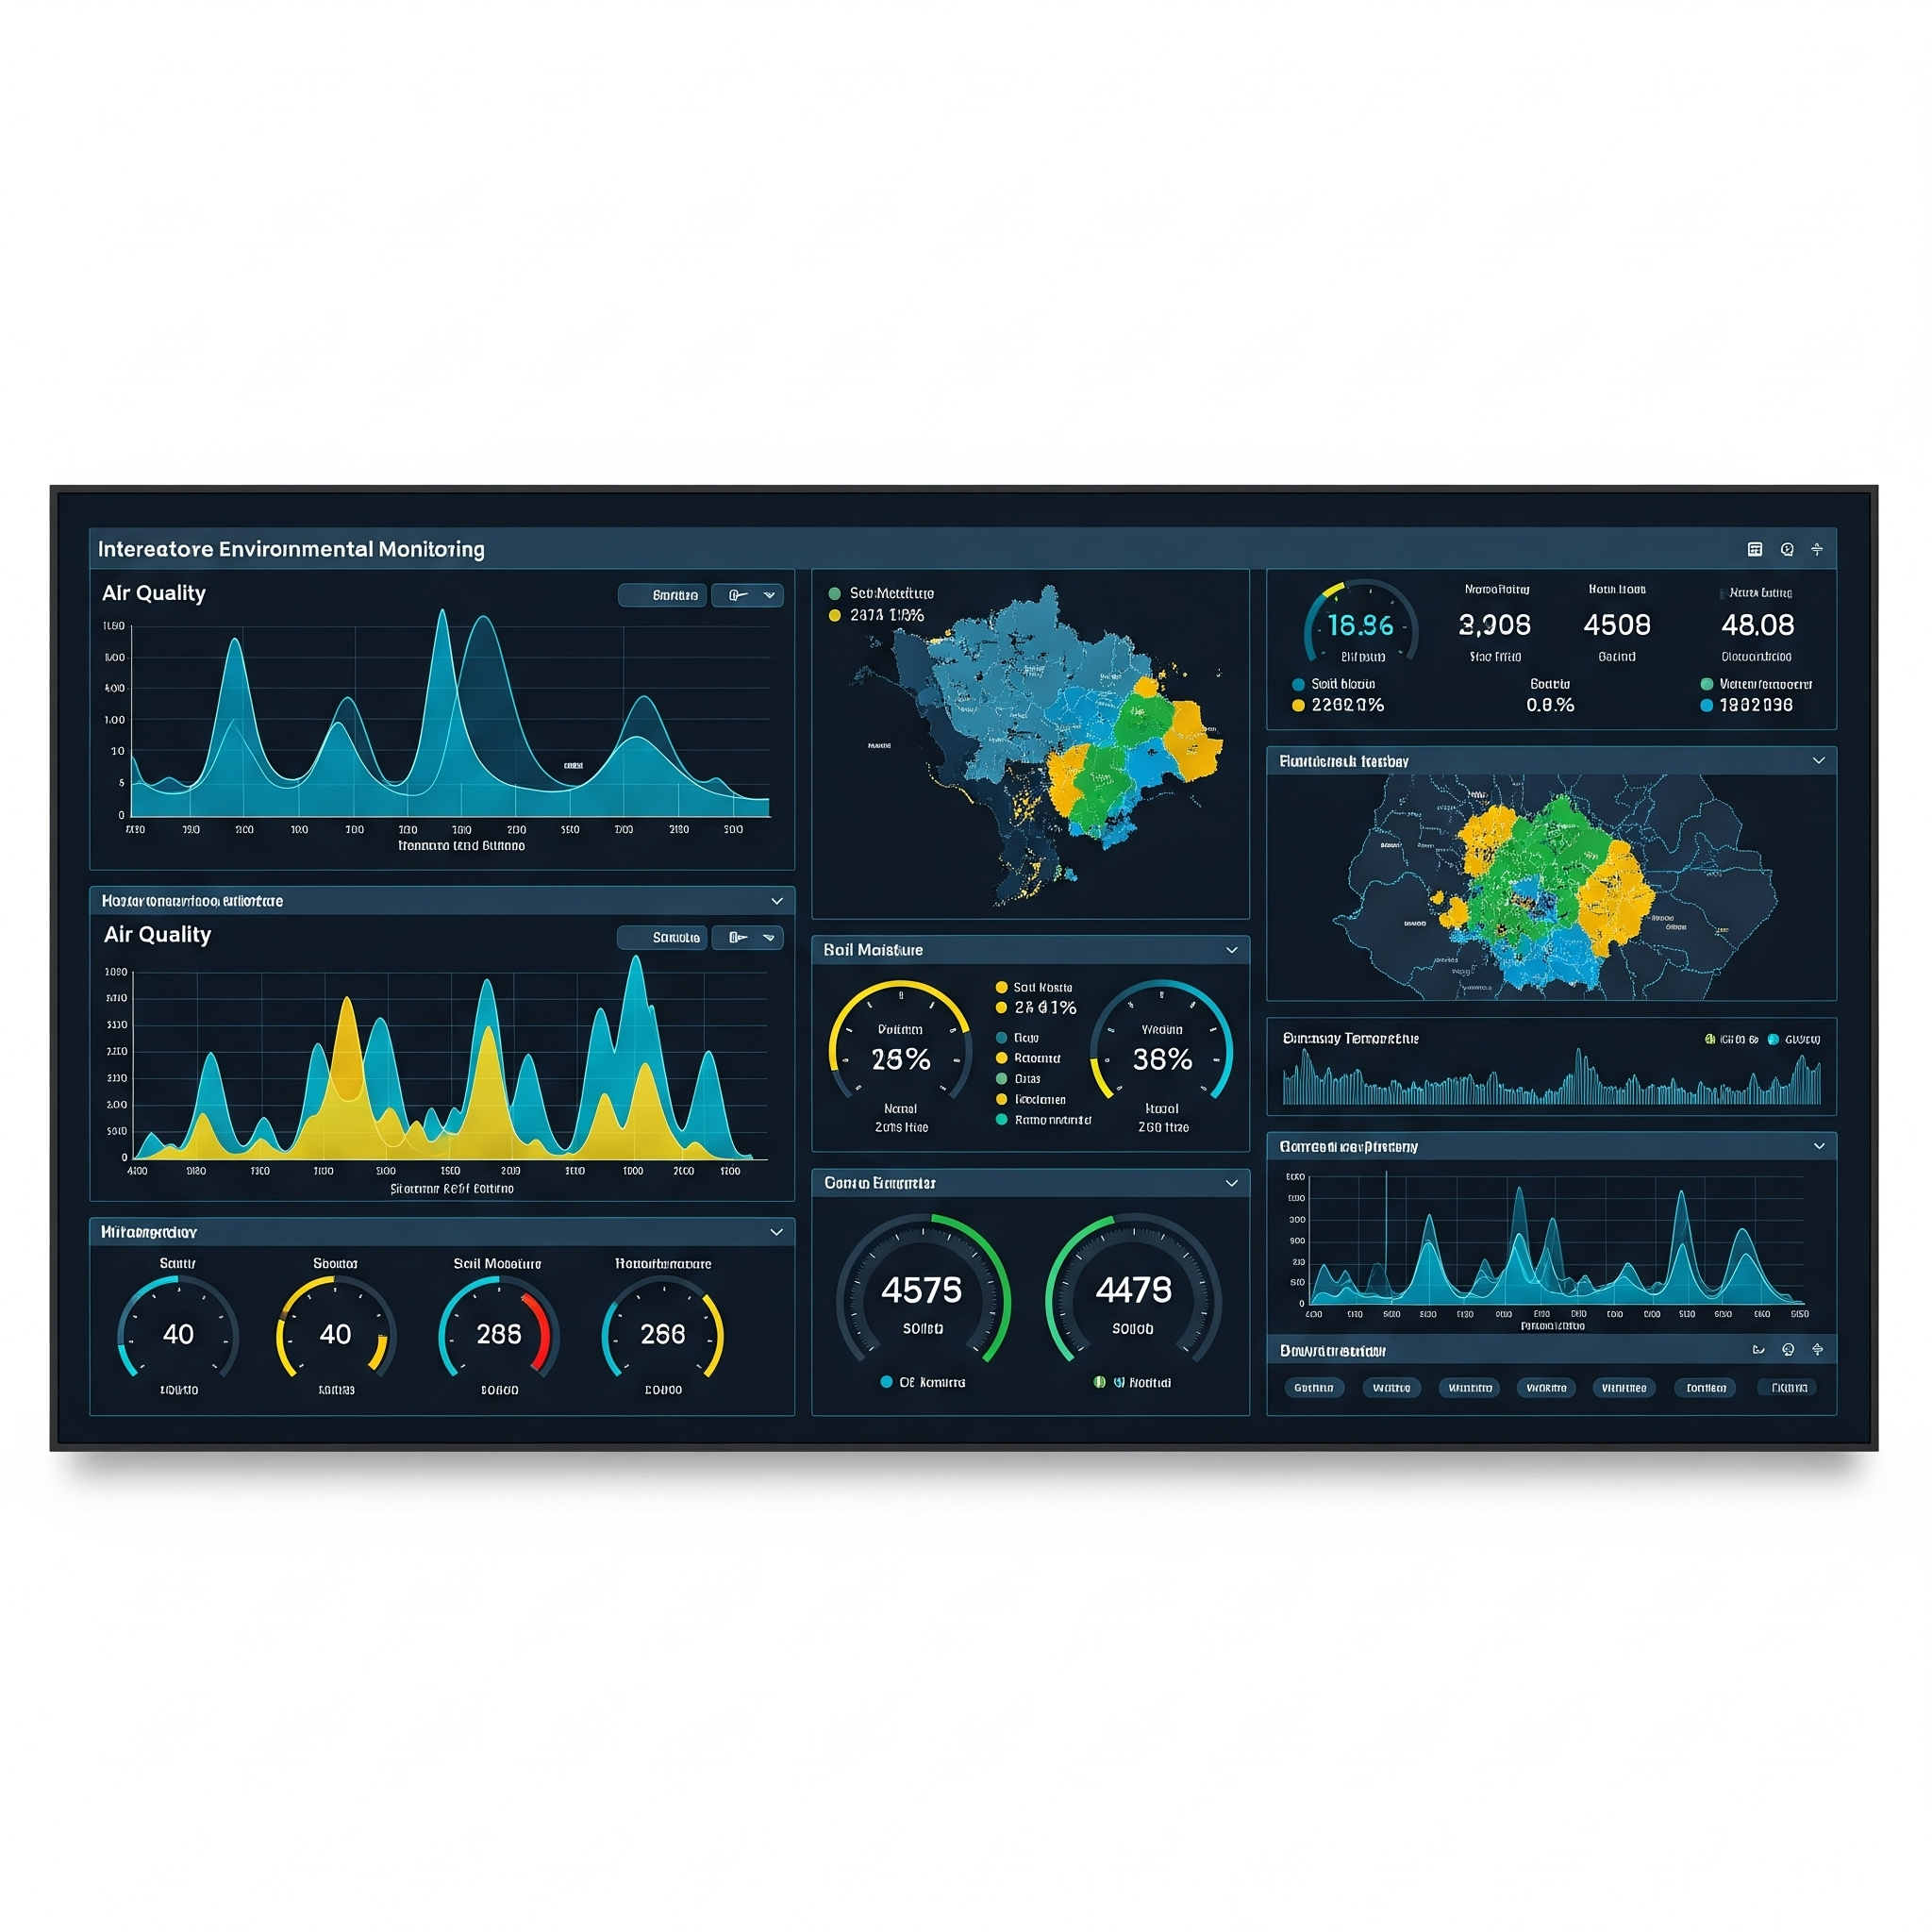
Environmental Monitoring Dashboard with Sensor Data
Built a GIS dashboard to visualize real-time sensor data (air quality, water levels) on an interactive map.
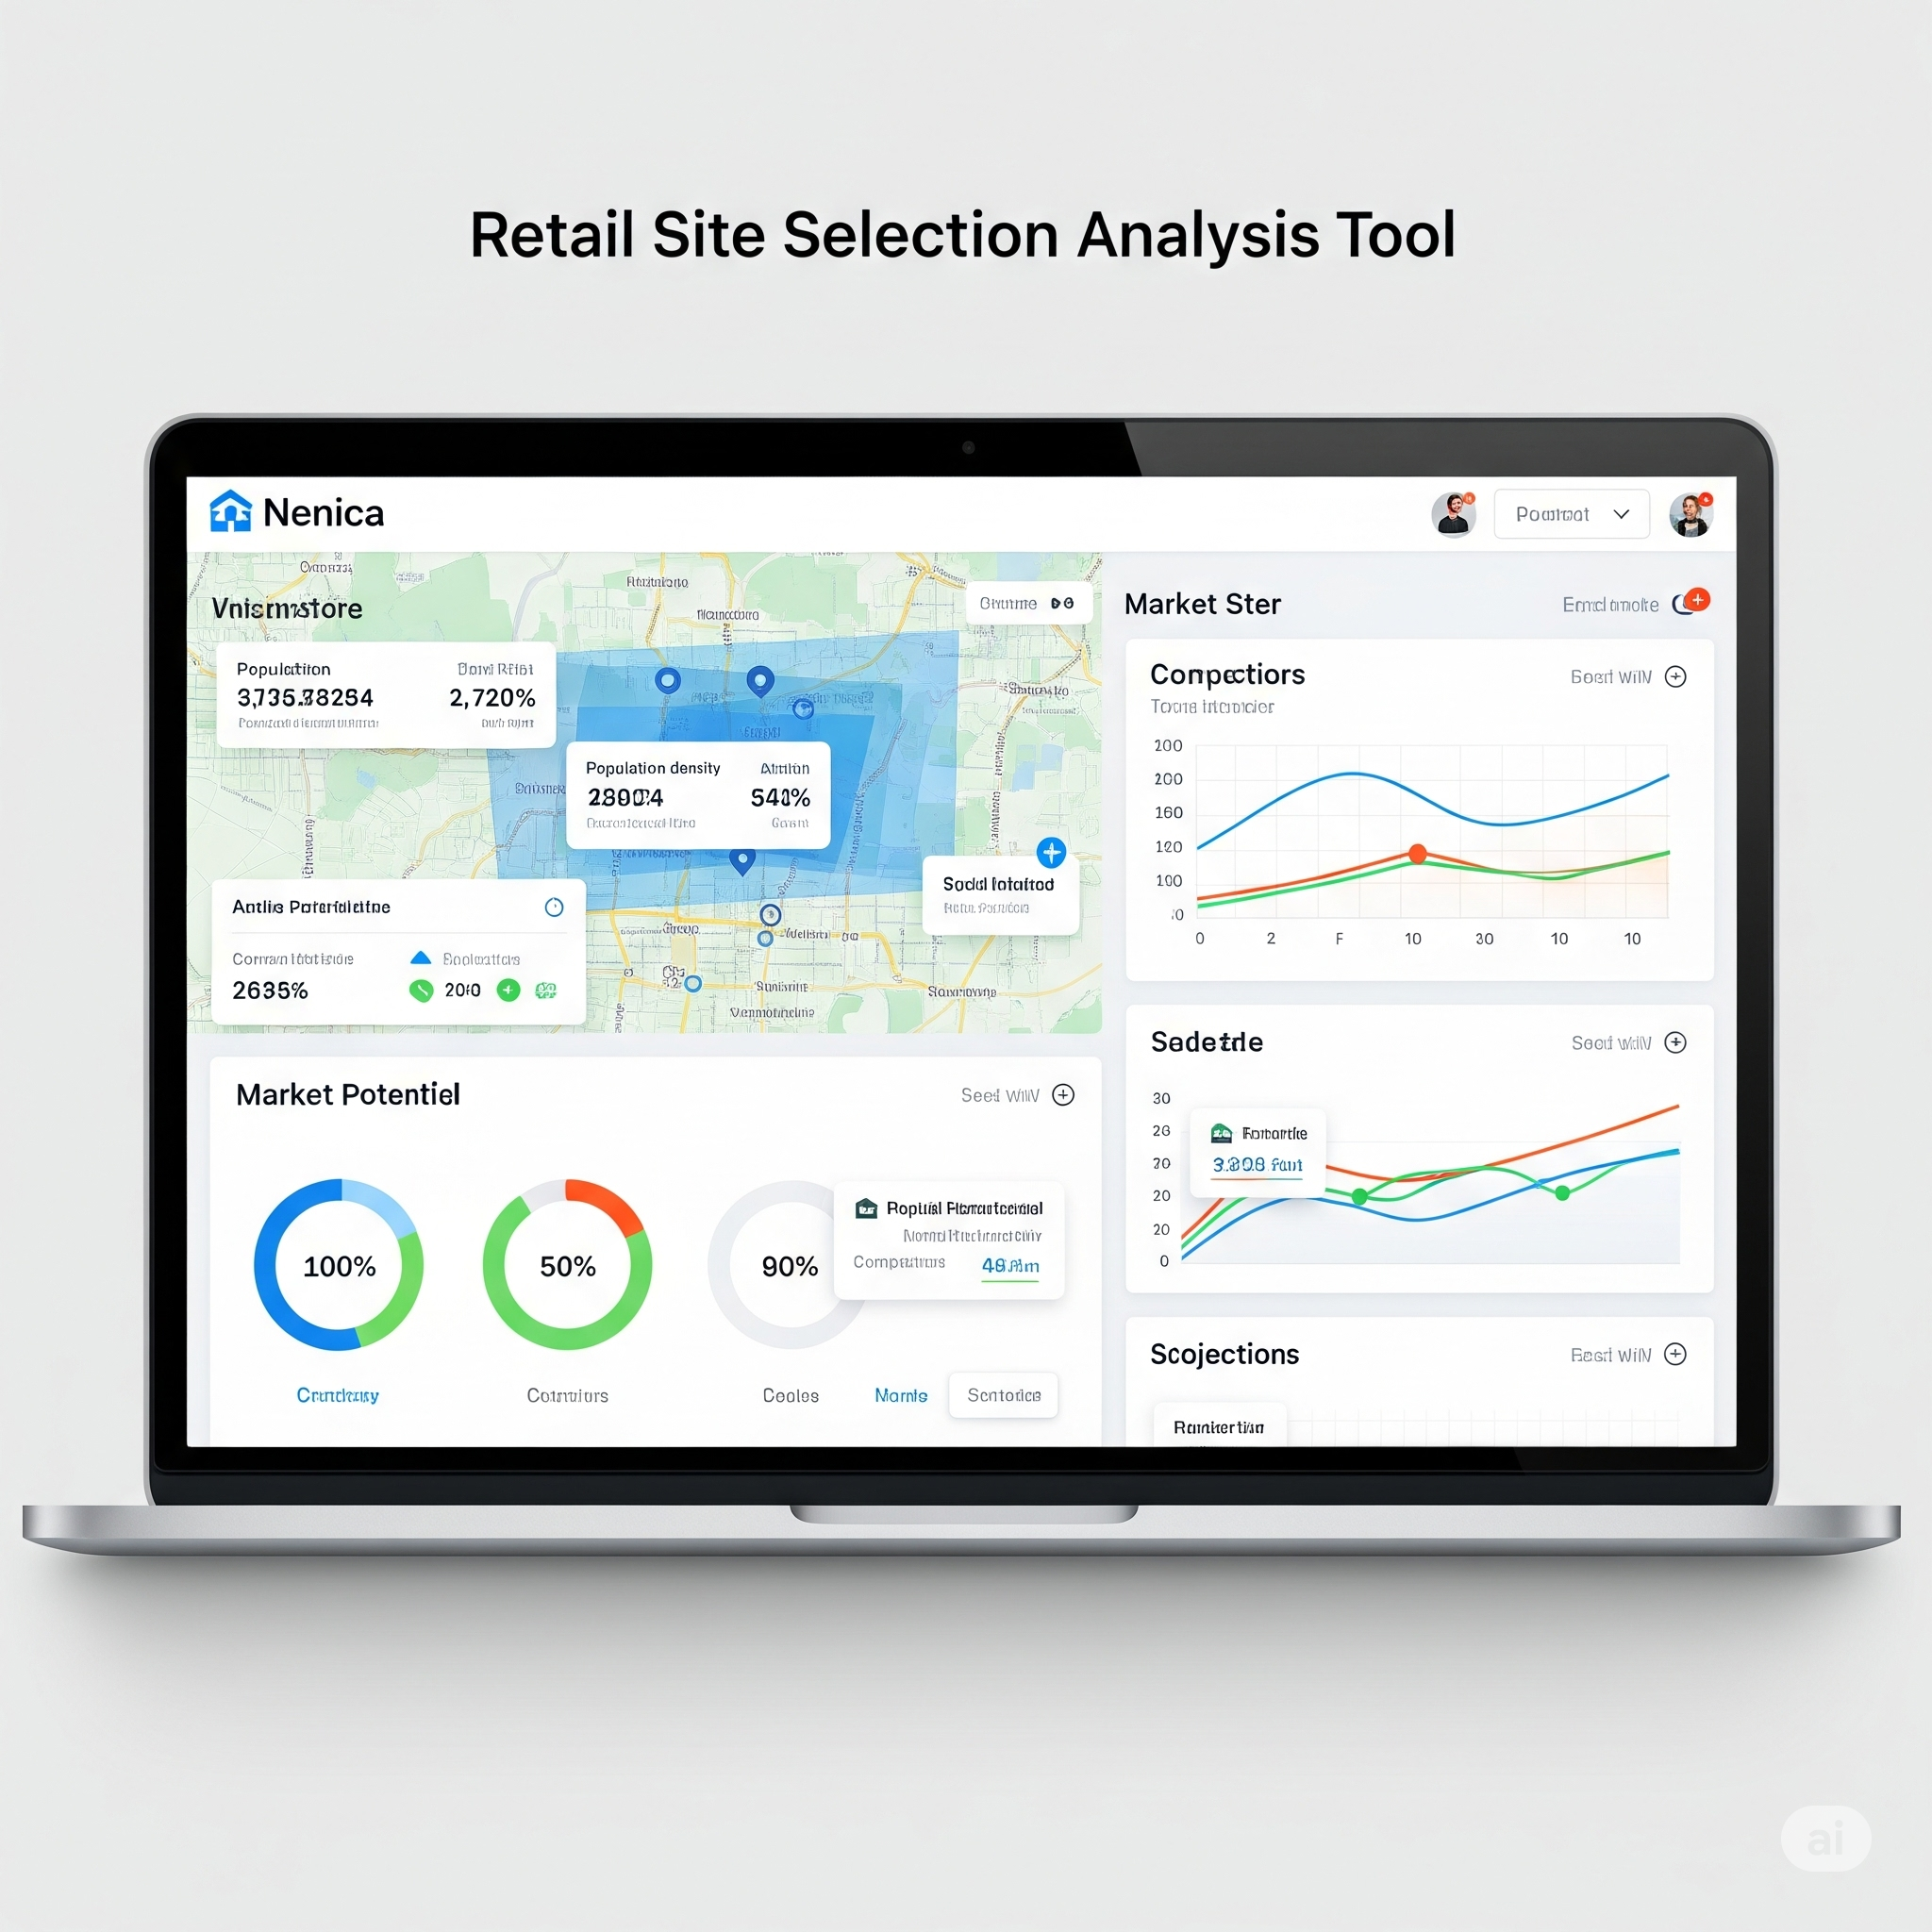
Retail Site Selection Analysis Tool
Developed a GIS tool to analyze potential retail locations based on demographics, competition, and accessibility.
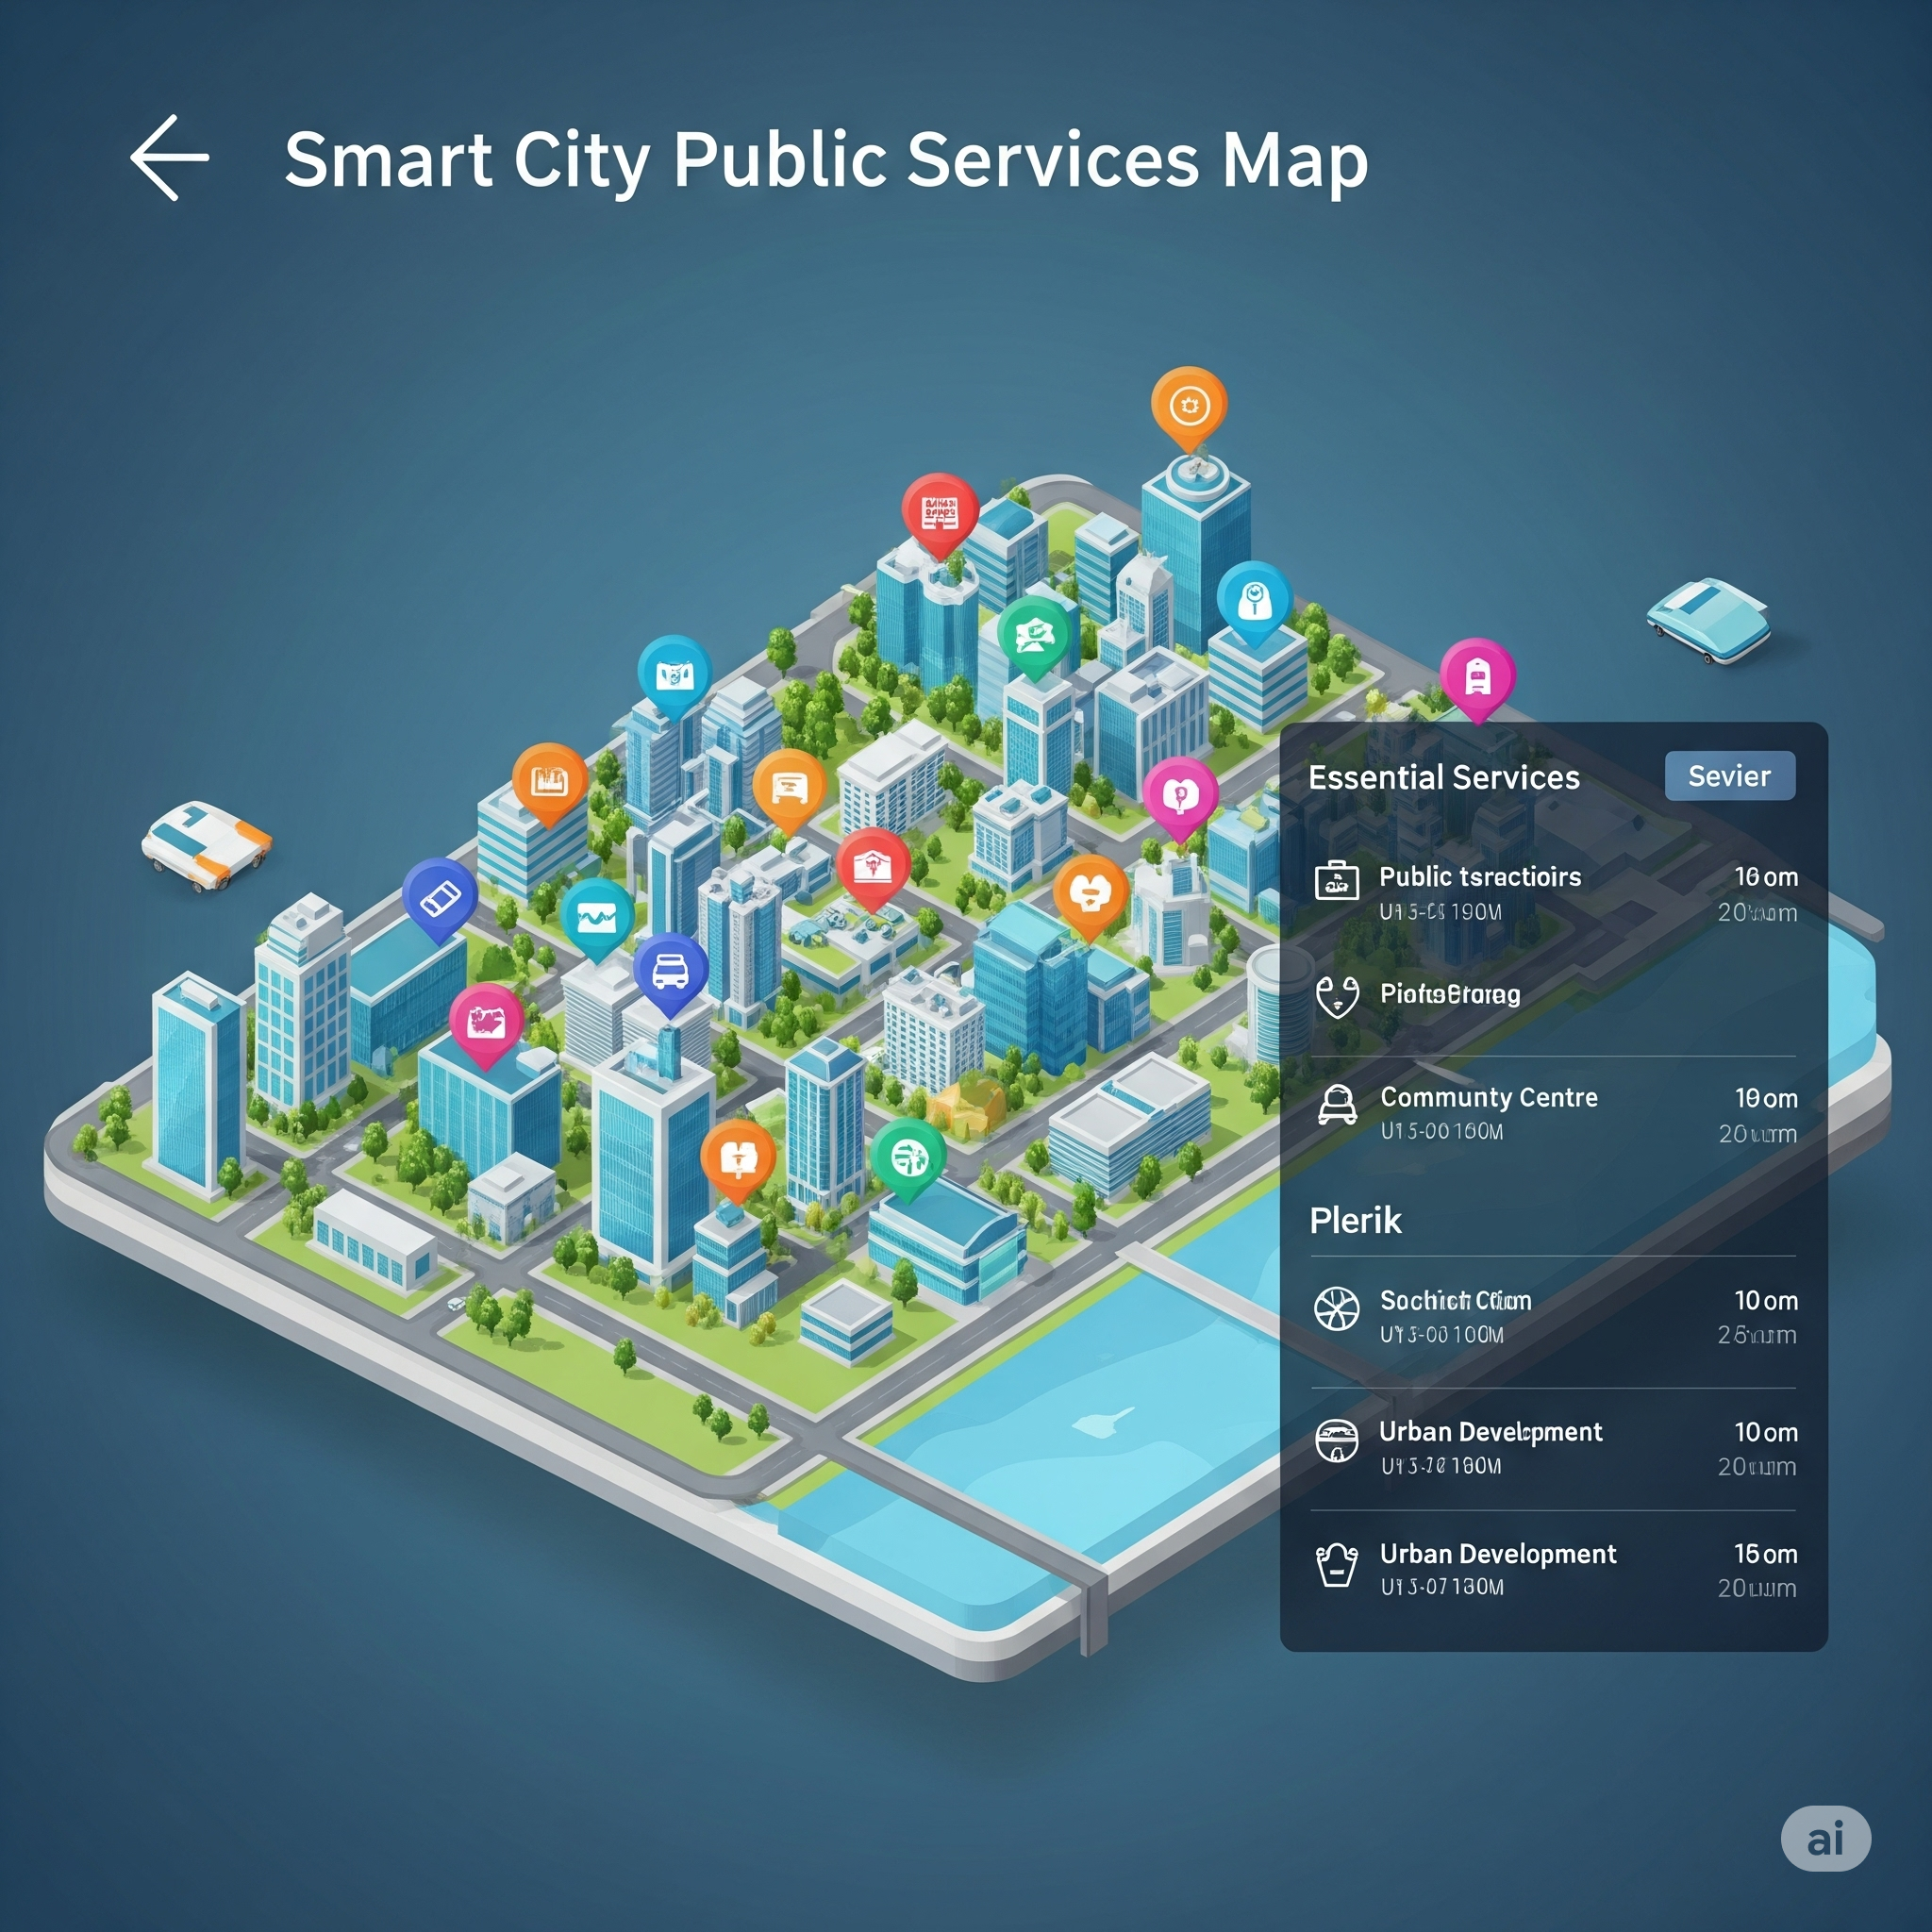
Smart City Public Services Map
Created a public-facing map showing locations of city services, public transport routes, and points of interest.
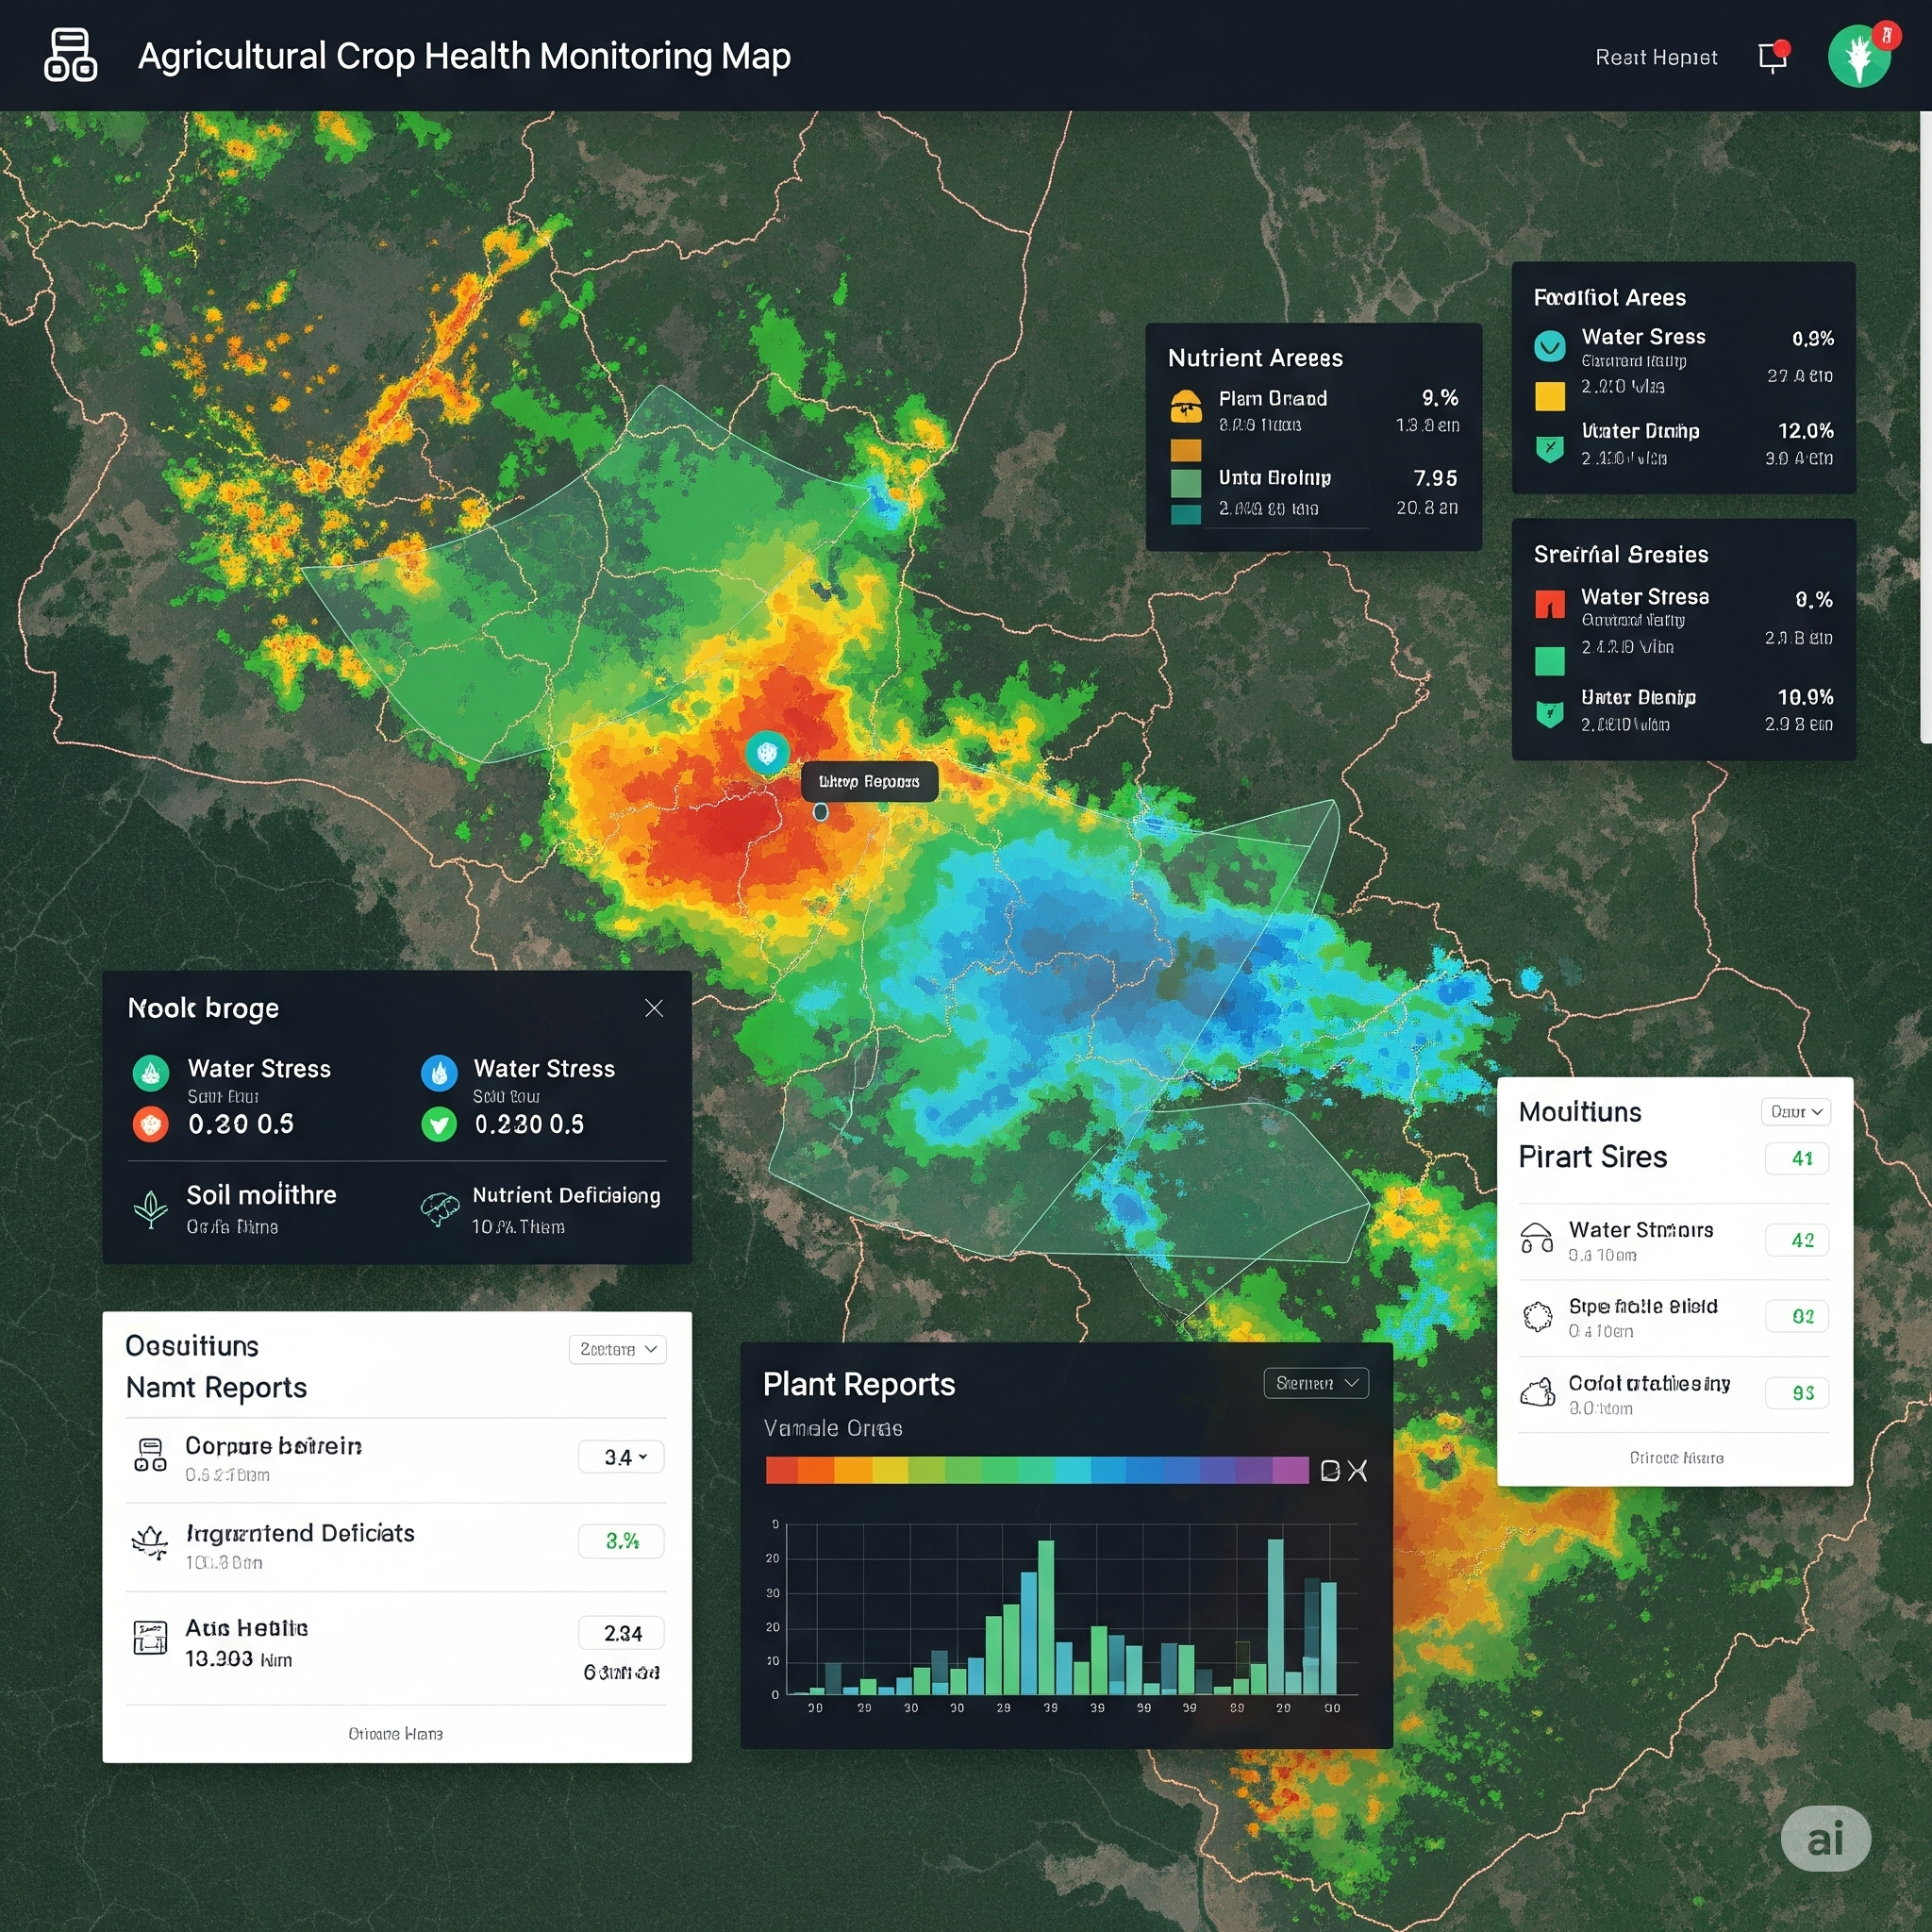
Agricultural Crop Health Monitoring Map
Integrated satellite imagery and drone data into a GIS platform to create maps highlighting crop health variations.
Technologies We Leverage
Frequently Asked Questions (FAQs)
GIS-enabled mapping and dashboards combine geographic information systems with real-time data visualization. They allow businesses, governments, and organizations to analyze spatial data, track assets, and monitor activities through interactive maps and dashboards, leading to better decision-making and improved operational efficiency.
GIS dashboards provide location-based insights by visualizing large datasets on interactive maps. Decision-makers can monitor trends, analyze spatial relationships, and access real-time updates. This improves accuracy, reduces risks, and enables faster responses in industries like urban planning, logistics, environmental monitoring, and public safety.
Industries such as transportation, utilities, real estate, healthcare, agriculture, and government services benefit from GIS dashboards. They use location intelligence to track resources, plan infrastructure, optimize service delivery, and enhance customer engagement while ensuring transparency through interactive and data-driven geographic visualizations.
Yes, GIS-enabled dashboards can seamlessly integrate with ERP, CRM, IoT, and business intelligence platforms. This integration allows organizations to combine geographic data with operational data, creating a unified system that supports advanced analytics, real-time monitoring, and smarter business strategies.
Key features include interactive maps, real-time data visualization, customizable layers, spatial analytics, geocoding, and performance tracking. Users can drill down into location-specific data, filter insights, and generate reports, making GIS dashboards powerful tools for both day-to-day operations and strategic planning.
Latest Insights
Stay updated with our thoughts on technology, industry trends, and innovation.

Blog
Autonomous AI Agents for Enterprise Operations in 2026
July 10, 2026
The use of AI has moved beyond basic automation and predictive analytics. In 2026, enterprises are entering a new era wh...
Read More
Blog
Top 10 AI Automation Opportunities for Enterprises in 2026
July 09, 2026
AI is no longer just an emerging technology. It has become a key business enabler. In 2026, AI Automation for Enterprise...
Read More
Blog
How to Build an AI Adoption Roadmap in 2026
July 08, 2026
Artificial intelligence is no longer a technology reserved for large enterprises or experimental projects. Companies of...
Read More
Blog
When should Enterprises choose On-Premise ERP? A Complete Guide
July 07, 2026
In an era of businesses that are increasingly seeking to transform into digital enterprises, one of the key technology d...
Read MoreGet In Touch
Let's discuss how we can help you achieve your goals. We're here to listen.
Send Us a Message
Direct Assistance & Quick Info
Contact Directly
support@aeologic.com +91-120-3200058 +91-120-3200059 +1 917-382-5712 (USA)Mon - Fri, 9:00 AM - 6:00 PM (IST)
Looking for Quick Answers?
Our Office
Plot no. C-28 & 29, C Block, Phase 2, Industrial Area,
Sector 62, Noida, Uttar Pradesh-201309
Sales Offices
United States
Jacksonville
3897 Eunice Road, Jacksonville, Florida
32250
United Kingdom
London
37 Millharbour, South Quay, London E14 9HB
South Africa
Parktown North
Johannesburg 2193